When is the best time to list a home in Seattle or on the Eastside? Let’s take a look at our typical seasonal housing market trends. Here’s a series of graphs showing activity from December 2012 to December 2014.
As you can see below, things heat up early in the year, with new listings (the blue line) and the number of homes going pending (the red line) both increasing significantly. During the past two years we’ve seen a lot of multiple offers each spring. This typically shows up on the graph in places where the pending line keeps pace with the new listings line (arrows below).
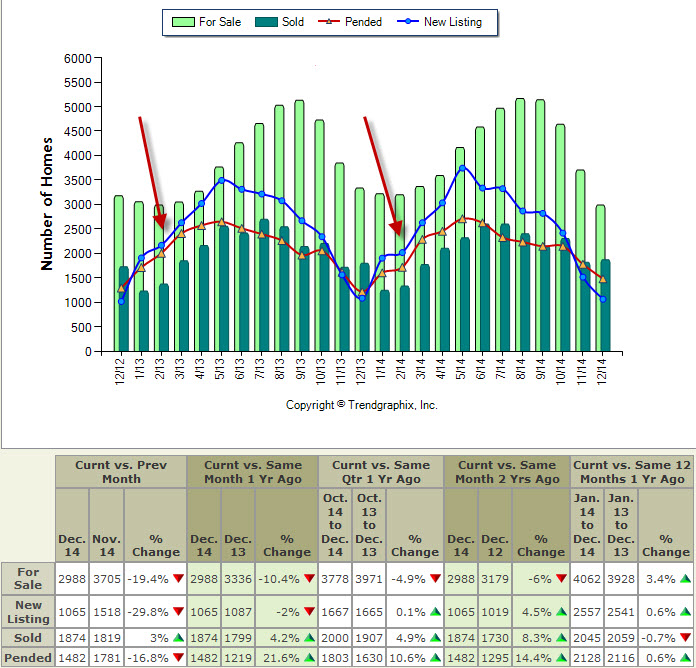
Things typically flatten out for a few months starting in June, with the slowest month usually being August. We then often see a perk in the fall around October. Last year (2014) August was very slow due to good weather (everyone was out playing) and a stock market hit, followed by an unusually busy October and November – compare the Fall 2013 and 2014 pending lines.
Looking at the chart above, you can see why media reports about the housing market are so misleading sometimes. Homes that close in June and July went pending 30 to 45 days earlier, and therefore reflect market conditions of 4 to 6 weeks prior to their closing date. This “sold home” data for June and July gets collected and crunched by organizations such as Case-Shiller, the numbers get released a month or two later, and it seems that every August the headlines are full of news about a “blazing hot summer market”, when in reality the sales numbers are coming from homes that went pending in late spring, and summer is when we typically experience a lull in the market, not a perk.
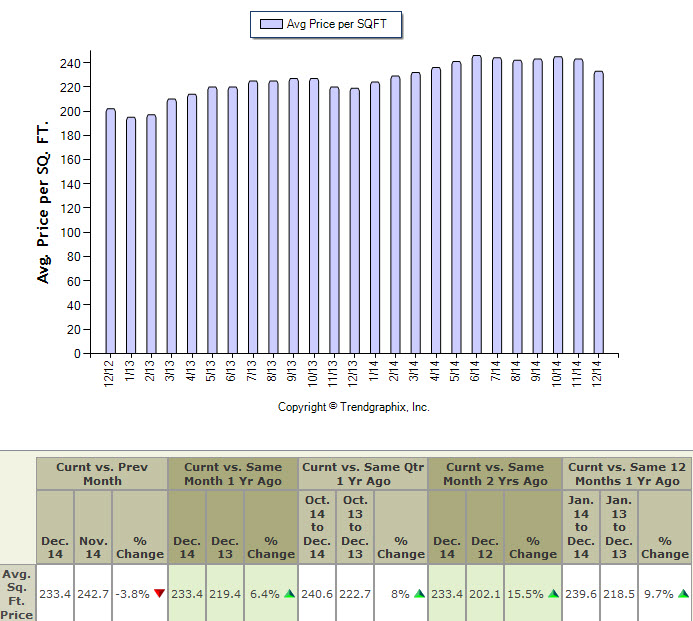
The chart above shows the same basic trends in average price per square foot.
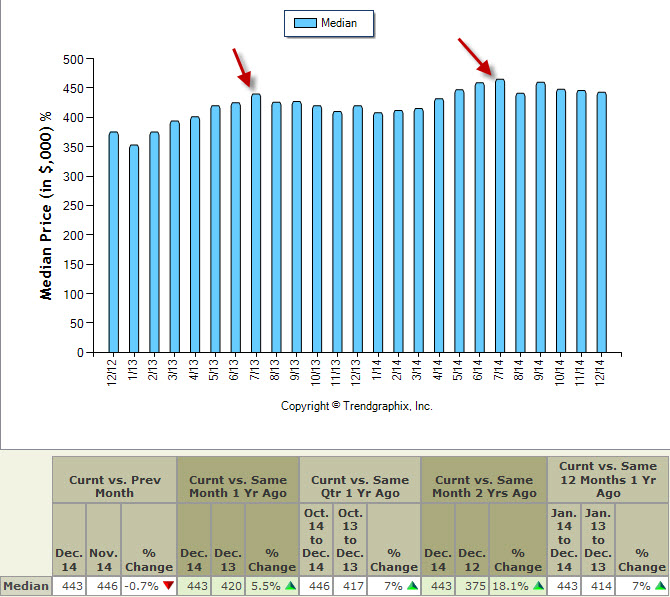
The chart above showing median sales price demonstrates why it’s so important to understand seasonal price trends when listing a home in June or July. The common mistake is to look at the high activity level in the spring and price upwards from there, when in reality you need to expect a slowdown in the market and price a bit more conservatively. Note that these are closed sales, so July numbers reflect May and June activity – and August closings indicate that July was slower in both years.
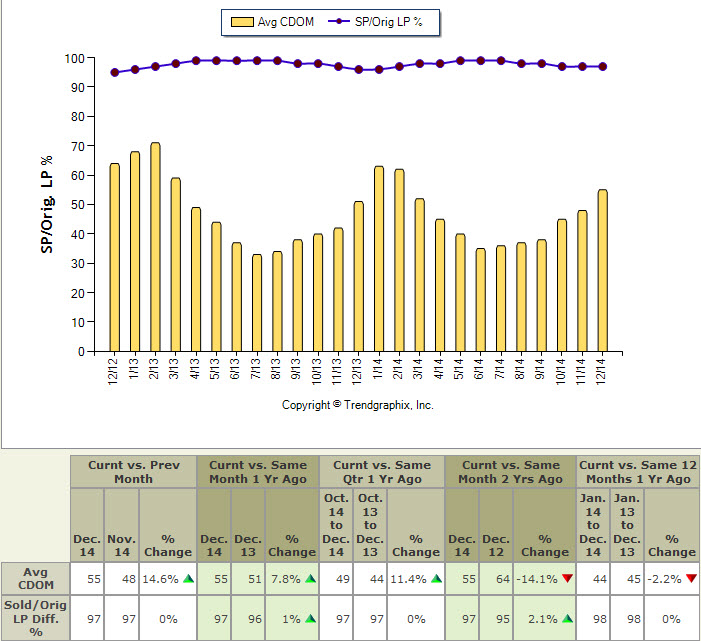
Cumulative Days on Market (CDOM) tends to decrease during the spring as more buyers get into the market. Sales Price as a Percentage of List Price tends to increase during that time as well during hot markets due to competition and multiple offers.

The chart above shows “Months of Inventory Remaining” based on pending sales, which is the number of months it would take to run out of our current inventory if homes continued to go pending at a consistent rate. Anything under 3 months is considered a seller’s market, and we are now at 2 months.
What’s worth noting here is the difference between Fall/Winter 2013 and 2014. Whereas Months of Inventory increased sharply at the end of 2013, last year it actually decreased and we are down 12.3% comparing those two fall quarters.
So, when is the best time to list a home in the Seattle or Eastside area?
As you can see from the data above, it’s worth exploring what’s happening in the specific price range of your home, but here are some seasonal patterns we see consistently.
January and February: People are still wondering what the market is going to do. Buyers who got skunked in the fall if their market was competitive may be ready to jump on something before things heat up too much. Agents looking at fall pricing have a tendency to under-price. On the plus side, your home should have less competition; on the minus side, if home prices accelerate throughout the spring you could miss part of that boost.
March, April and May: Often these are ideal months in which to list a home, especially if there is not a surplus of inventory. If the market is competitive everyone is aware of that by March or April, many buyers have lost out on previous offers and are ready to make their best effort, and typically we still don’t have as much supply as we see in mid-summer.
Late May and June: These are typically good months as well because if there has been a price run-up in the spring, your home can benefit from that. The key is to know that in June the market usually starts to enter a lull that lasts through August, so pricing on the high side can leave a home priced above market and sitting.
July and August: These tend to be slow months and we usually have more inventory, so again, while listings can benefit from springtime trends it’s important to price carefully.
September, October, and November: We usually see the market perk up again after kids are back in school. Many buyers want to be in a home by the holidays. In 2014 we saw very strong activity and multiple offers in October and November.
December: Things tend to wind down through early January. On the plus side there is usually less inventory to compete with; on the minus side, buyers are distracted and traveling for the holidays.
This year – January 2015: I expect a strong year for sales. While the national forecast is for more homes to go on market than last year, the number of sales is projected to increase as well, and here in the Seattle area I’m seeing and hearing about multiple offers frequently already. So far it looks like our typical spring pattern is starting out as it usually does, and we’ll just have to see if we get an enormous boost in inventory that might shift the balance unexpectedly.
 No matter when you list, the key to getting the most from your home sale is first-class preparation, excellent home staging and professional photography. I can not stress enough how crucial these are to selling your home for the best price. Mike and I include consulting, home staging and professional photography as part of our standard listing service because our goal is to increase the value of your home by doing these things before it ever goes on market. We’ve found that no matter what the price range, it always pays off for the sellers.
You can see examples of our Home Staging Photos and Before and After Pictures here.